There’s no longer any doubt about it, evaluating training performance is central to HR managers’ concerns. Today, Teach on Mars is harnessing the expertise of Good Data, a specialist in Business Intelligence, to offer new, reliable and relevant statistics to enable our clients to smoothly continue on their path to success.
At Teach on Mars, statistics are central to the support we provide to our clients. It is via their monitoring and analysis that we are able to recommend specific actions to ensure clients obtain better engagement and greater retention from learners using the training programme.
Our product team decided to work with BI experts to review and enhance our learning analytics, in order to enable our clients to monitor performance indicators for their application more simply. This is how Teach on Mars developed new statistics and new dashboards, to provide an increasingly comprehensive training offer.
5 new embedded dashboards
The new statistics are divided into 5 dashboards, grouped together in a new, dedicated Statistics section in the Mission Center.

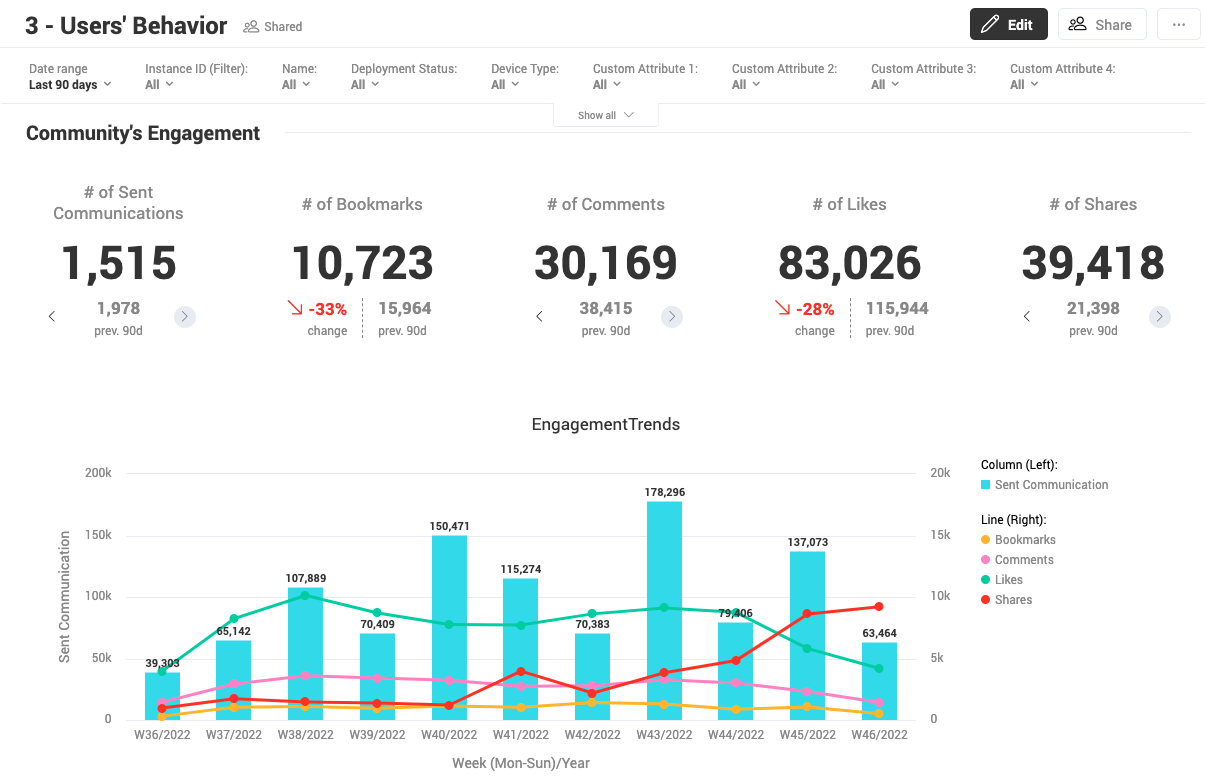
The Overview dashboard, on the Mission Center homepage, shows the 10 most important KPIs, giving an overview of the app’s state of health at a glance.
The 4 other themed dashboards allow you to go further to analyse learner engagement and retention on the application in general, and more particularly regarding the level of courses in the catalogue and on the Wall.
The new embedded statistics will gradually replace the Mission Center statistics.
No need to worry! You won’t lose any data, on the contrary, you will discover some new data.
New features to track indicators more closely
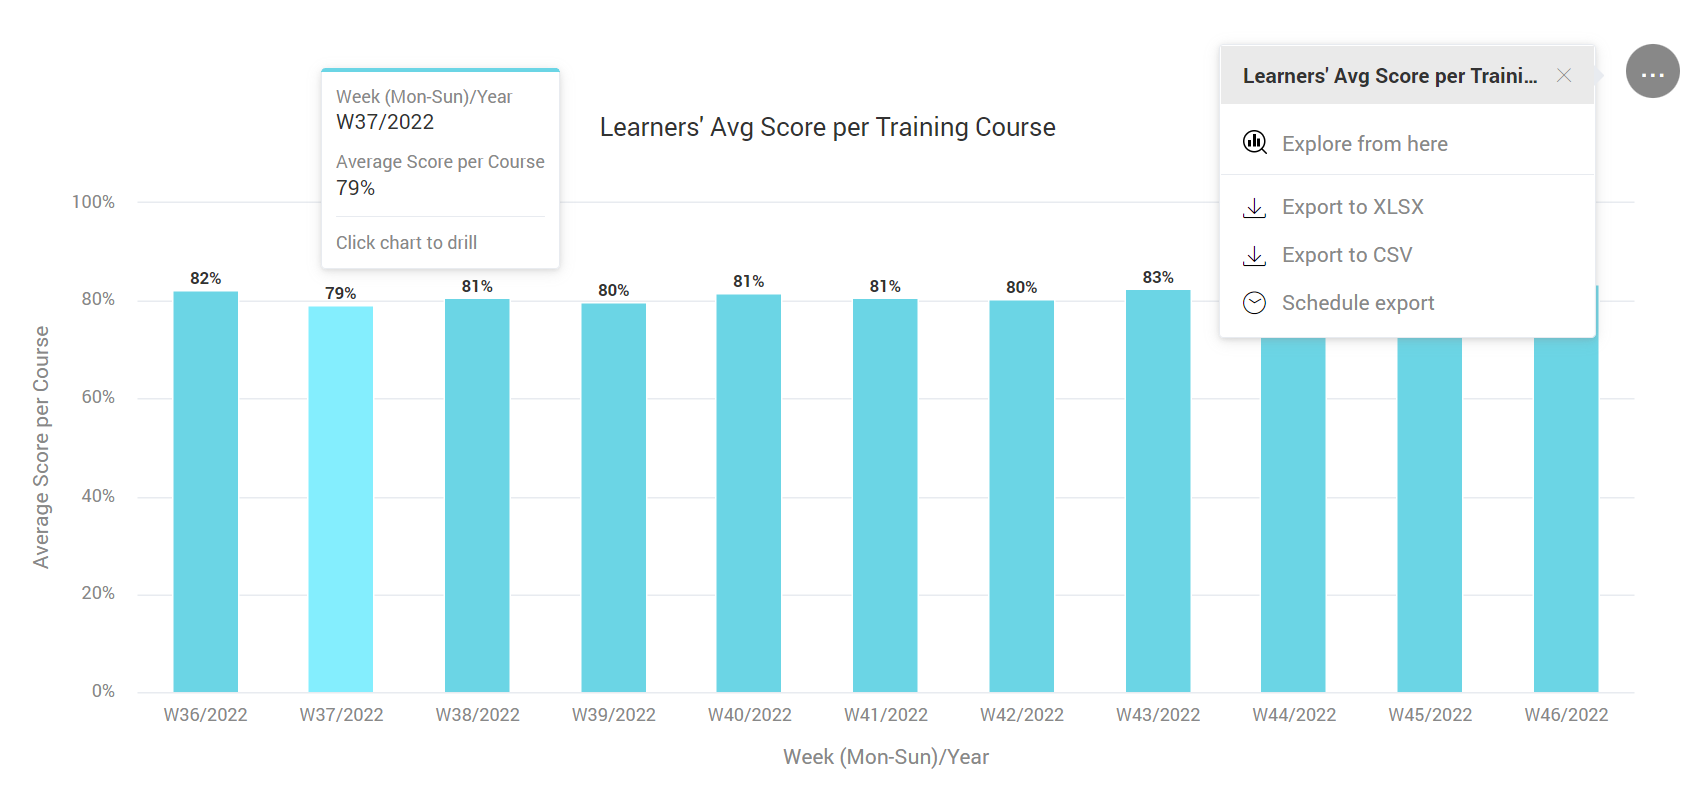
Exporting dashboards is still possible of course – in CSV or XLSX format.

Other innovative features enhance the new dashboards:
- The chance to apply very specific filters
The embedded dashboards all feature a time filter, enabling you to analyse KPIs for the date range you wish, whether it be last week, a particular day in the year or last quarter; you can choose!

- the chance to apply an email alert for certain indicators
This feature enables you to receive an email whenever a KPI reaches a certain value which you set. For example, if the number of your connected learners exceeds a certain threshold, you can be notified directly. This can be the perfect occasion to launch a competition with your 20,000 connected learners!

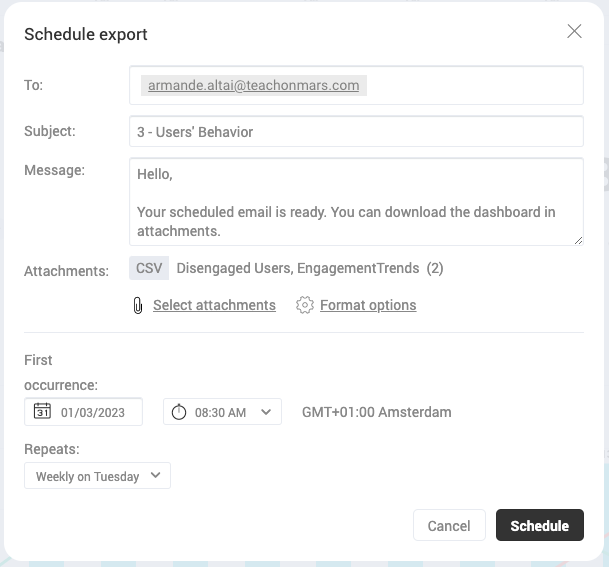
- the chance to schedule certain file exports
No longer any need to plan an alert on your agenda: thanks to the scheduled export you’ll receive the file directly in your inbox at a frequency which you select.

In 2023, KPIs rule!
In the first quarter of 2023, Teach on Mars will propose its first fee-based MyAnalytics offer, providing not only embedded dashboards in the Mission Center, but also the chance to create custom dashboards. Thanks to this premium offer, you can add, modify and share your own indicators, organised according to your own hierarchy. The MyAnalytics offer will also include customised onboarding for creating your dashboards, as well as the chance to compare indicators depending on the various learner groups.
A Mission Center analytics offer is set to follow, this time included in the price of the licences. It will allow all Mission Managers with access to statistics, to visualise the 5 embedded dashboards and to take advantage of the aforementioned features: email alerts, scheduled file exports, filters, etc.
2023 will be the year of the KPIs!
For any further information, please get in touch with your CSM or account manager.
Marielle has been travelling in the Teach on Mars rocket ship for 6 years. After having contributed her skills in pedagogical engineering and training facilitation to guide clients towards success, she is now Product Owner, in charge of designing the new features of the solution.


