All training professionals need reliable indicators to enable them to measure the impact of their initiatives with accuracy and continuously improve their learning solutions. To meet that need, Teach on Mars has added a series of brand new dashboards to the Mission Center of its mobile learning solution Teach on Mars.
General statistics, key performance indicators, training system status
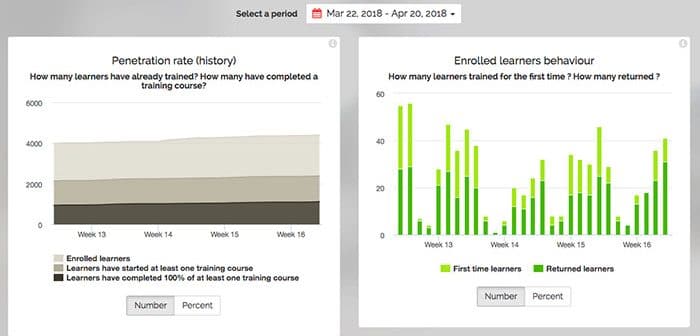
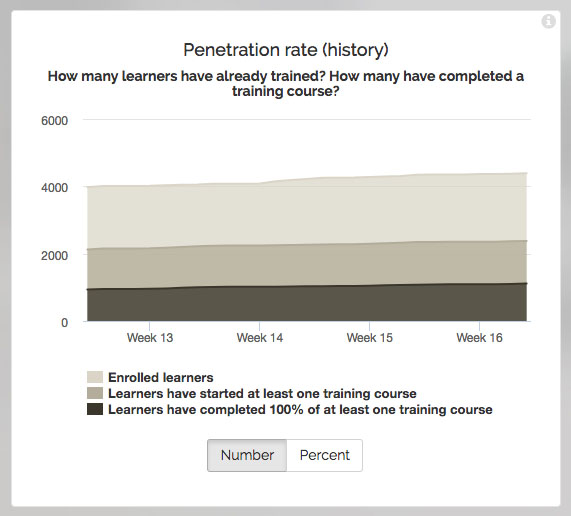
The Teach on Mars administration interface – our renowned Mission Center – now gives you a complete view of the level of activity of the learners in your mobile learning system. Thanks to our new dashboards you can see how many learners have connected to the app, how many have begun a training course, and how many have completed at least one training course. This will help you identify where and how you need to intervene to improve learner engagement. In addition, the learner retention graphic will tell you if users return to the App over time.
If you want to assess the efficiency of your corrective actions you can use the history of this indicator data. Use a date selector to zoom in on a precise time period and construct focused reports that enable you to track how your key data are moving day by day, week by week or month by month.
By monitoring the activity of your learner populations over time, you’ll be in a better position to optimise their engagement and loyalty to your learning programmes.
Mobile learning statistics, training summary, learning analytics
Mission Center now gives you detailed and precise usage statistics for every one of the training course you administer. For every piece of learning content in your system you can evaluate the engagement it generates and measure your learners’ progress. Diving even deeper, our learning analytics will let you identify which modules your learners made the most progress with, and which ones they got stuck or stalled on. . You can even pinpoint possible areas for improvement in your learning activities (such as which are too easy or too difficult).
There are also indicators you can use to monitor the status of your catalogue of training courses, such as the number of courses published or in editing mode, or the average number of training courses accessible per learner. This will enable you to build detailed reports for your senior leadership, or help you adjust your strategy on the amount of learning content you make available to your learners.
Finally, there are rankings which will show you which training courses are the most popular with your learners: which are opened the most, which are used the most, and which are completed the most.
Learner statistics, rankings and individual reports
Monitor in detail the progress and activity of your learners one-by-one thanks to the Mission Center’s individual reports: total time spent on learning, badges obtained, social media activity, even precise progress in an individual training course – it’s all there for every individual learner!
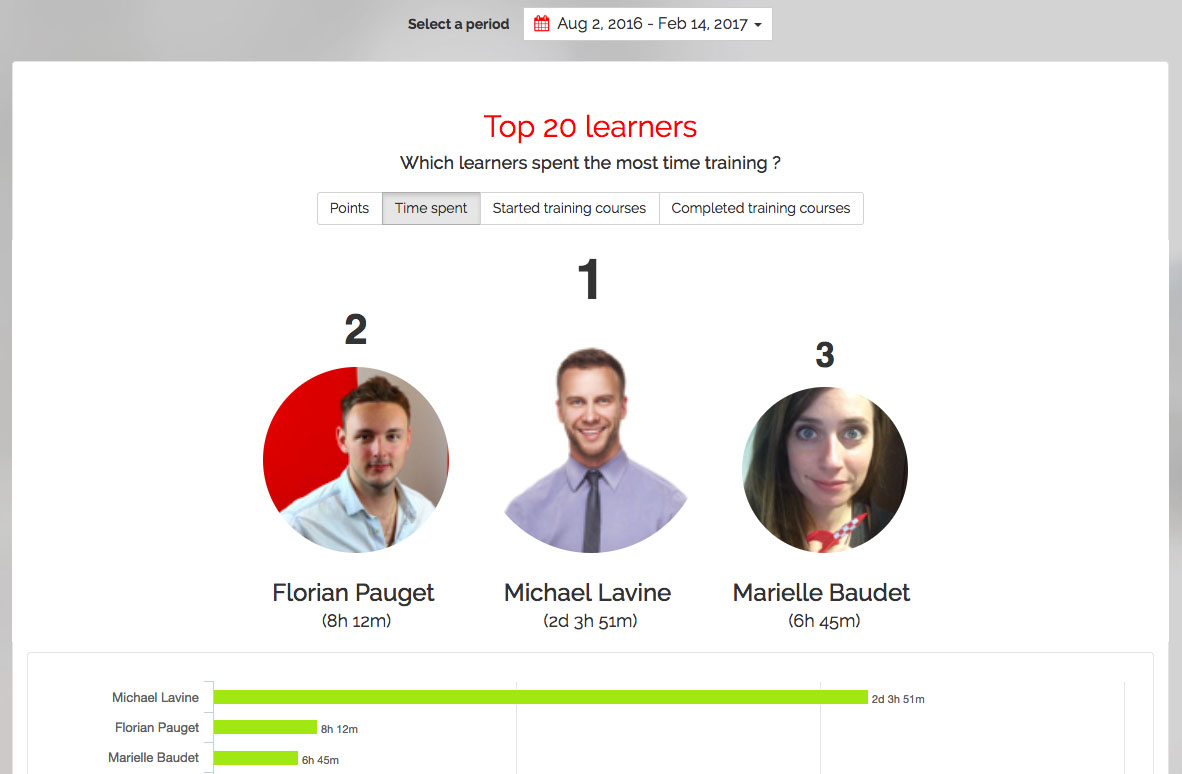
Through the rankings screens you can see which learners have scored the most points, completed the most training courses or shared the most communications. There are also learner rankings for each individual training course, which you can use to offer rewards to motivate your learners to develop their competences in the various areas where you offer learning content.
On a more general level, you can configure your own rankings of learner groups. So you can measure any aspect of the activity of your learner population – most active country, managers who have encouraged their learners to complete the most training courses, departments in the company that have racked up the most points – literally whatever you want to monitor.
Communication, learner engagement and social behaviour statistics
Mobile learning lets you use your learners’ smartphones to send them direct communications. They receive push notifications, consult the newsflow of their training app, and can “like” and “share” the communications you publish with other users. You can measure which of the communications you send to your learners via their “Wall” are having the greatest impact by identifying which are the most “liked” and “shared”, and then reproduce them to further drive engagement.
If you are bewildered by the range and number of dashboards the Mission Center offers, the Teach on Mars Academy can help with guidance and ideas. Drop them a line at contact@teachonmars.com and they’ll be delighted to help.
And remember, there’s much more to Teach on Mars than just analytics. Check out all the benefits of our mobile learning solution.

Delphine accompagne depuis plus de 20 les organisations dans leurs grands projets de transformation. Après une première expérience de 7 ans dans le conseil sur des dispositifs d’accompagnement au changement (mise en place de nouveaux modèles d’organisation, accompagnement des collaborateurs dans le cadre de fusions, évolution de pratiques managériales/RH…), elle a intégré le groupe Crossknowledge en 2005 et déployé une offre de services novatrice pour assurer le succès des projets de digital learning dans les grands groupes. Elle a rejoint ensuite Teach on Mars en 2018, et en est le COO depuis 2021. Elle pilote actuellement le développement du portefeuille de clients existants ainsi que les activités de notoriété de la marque.


